Beispielaufgabe Punkte im Koordinatensystem
In diesem Beispiel wird ein JSXGraph-Objekt genutzt, um Werte angelegter Variablen als Punkt in einem Koordinatensystem anzuzeigen.


Verwandte Themen
Um dieses Beispiel selbst zu erstellen, gehen Sie wie folgt vor:
| Erstellen Sie eine Lückentextaufgabe. Legen Sie die Variablen 'var_x' und 'var_y' mit dem gewünschten Wertebereich an. | 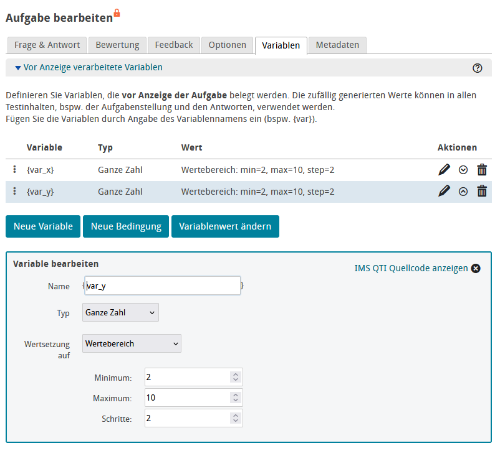 |
| Erstellen Sie den Text der Aufgabenstellung und die benötigten Lücken für die Eingabe. Referenzieren Sie dort die angelegten Variablen. | 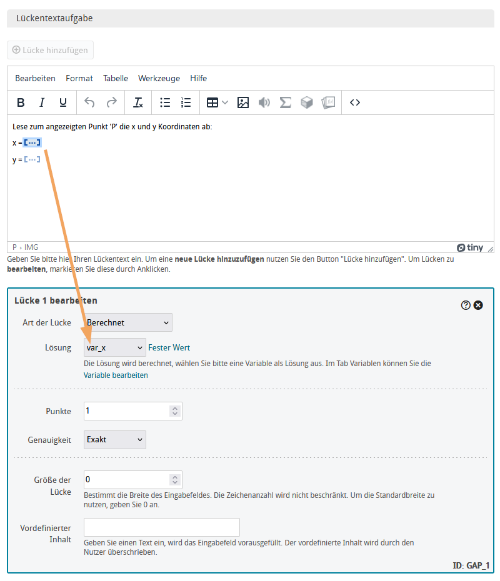 |
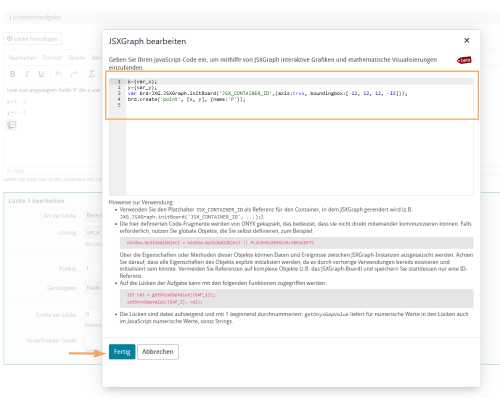
Fügen Sie mit Klick auf das Icon x={var_x}; y={var_y}; var brd= JXG.JSXGraph.initBoard('JSX_CONTAINER_ID', {axis:true, boundingbox:[-12, 12, 12, -12]}); brd.create('point', [x, y], {name:'P'}); Dabei erzeugt die Methode JXG.JSXGraph.initBoard() das Feld für die Grafik.
|  |
| Prüfen Sie in der Vorschau ihre Angaben und Speichern Sie die Aufgabe | 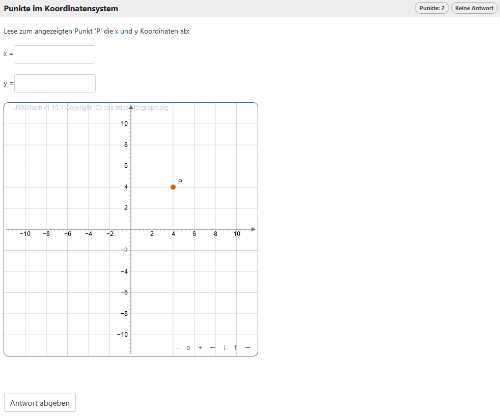 |
Der folgende Code nimmt die x-Koordinate des Punktes 'P' aus der ONYX-Variablen var_x und malt diesen Punkt (mit der y-Koordinate 1) in eine JSXGraph-Tafel: