JSXGraph Example: Points in a Coordinate System
Last modified by Anna Paul-Hasenfuss on 19.06.2025
In this example, a JSXGraph object is used to display the values of created variables as points in a coordinate system.


To create this example, proceed as follows:
| Create a text entry interaction with the variables 'var_x' and 'var_y' and your intended value range. | 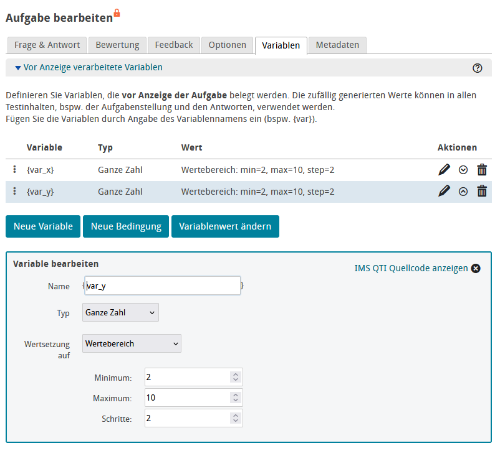 |
| Now, write the text for the task and create the gaps that need to be filled in. Also, reference the variables you have created there. | 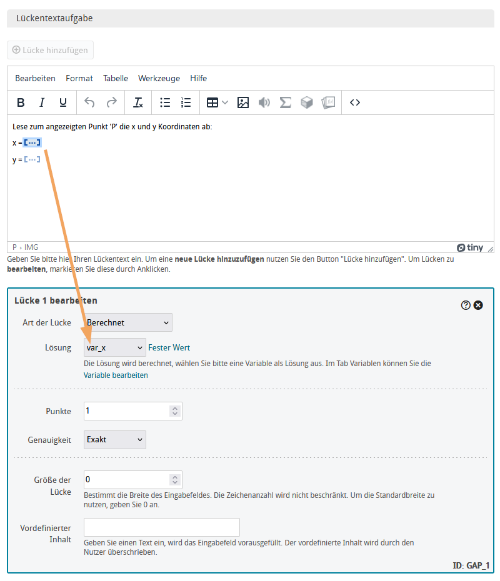 |
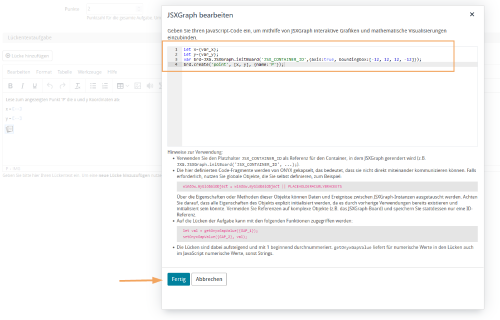
Add a JSXGraph object by clicking on let x={var_x}; let y={var_y}; var brd= JXG.JSXGraph.initBoard('JSX_CONTAINER_ID', {axis:true, boundingbox:[-12, 12, 12, -12]}); brd.create('point', [x, y], {name:'P'}); The JXG.JSXGraph.initBoard() method creates the field for the graphic.
|  |
| Check your details in the preview and save the task. | 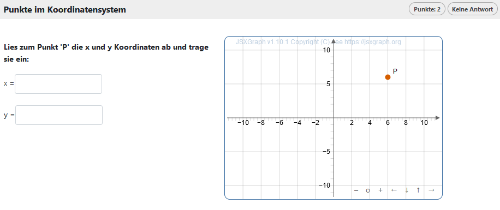 |